Friday, February 15, 2013

Mapping Damascus Over Time

The city of Damascus has always intrigued me. Maybe because it is the oldest established metropolis in the Levant region and the most continuously inhabited city in the world, or maybe it is because it is in the heart of the Middle East. Regardless of the reason behind this intriguing city, it is interesting to see how the city developed over time from a spatial perspective.  I have compiled a list of eight maps to show how the city developed since the Romans occupied the Levant region of the Middle East.  The first in the series of maps shows the various empires throughout history that helped shaped the city into its early 20th century boundaries.  Then each of the following maps progressively show how Damascus grew over time.  Now with the civil war destroying this city, it would be interesting to see how the city will be altered again.
Map 1: Urban Evolution of the City of Damascus - Roman Era until the 1960's

Map 2: French cartographic map of Damascus in 1929

Map 3: Cultural Map of the city of Damascus in 1936

Map 4: Growth of Damascus from 1936 to 1994

Map 5: Population Growth of Damascus, 1981 to 2000

Map 6: The City of Damascus in 2004
Map 7: The inner-city of Damascus, Present Day

Map 8: Present day satellite imagery of Damascus


Map Sources:

Map 1: Al-Qattan, N. (2002) Litigants and Neighbours: The Communal Topography of
           Ottoman Damascus Comparative Studies in Society and History Vol 44 No 3, p 511-533.
Map 2: Bureau Topographique des Troupes Francaises du Levant (1929) Damas available from  
           http://historiccities.huji.ac.il/syria/damascus/maps/tfl_1929_damascus.html
Map 3: a) Map - Al-Qattan, N. (2002) Litigants and Neighbours: The Communal Topography of
           Ottoman Damascus Comparative Studies in Society and History Vol 44 No 3, p 511-533.
           b) Religion overlay - Khoury, P.S. (1984) Syrian Urban Politics in Transition: The Quarters of
           Damascus during the French Mandate International Journal of Middle East
           Studies Vol 16 No 4 p 507-540 (1984).
Map 4: El-Ibrahim, K. (2001) Spontaneous Settlements around the City of Damascus
           Damascus: University of Damascus, p 80Map 5: El-Ibrahim, K. (2001) Spontaneous Settlements around the City of Damascus
           Damascus: University of Damascus, p. 71
Map 6: http://en.wikipedia.org/wiki/File:Districts_of_damascus.gif
Map 7: http://www.studio-basel.com/assets/files/files/21_urban_development_of_damascus_web.pdf
Map 8: Astrium Geo. 2012. http://www.imagekind.com/Damascus-Syria--Satellite-Image-art?
           IMID=5cd73cc1-6559-42a0-a1c0-b1d745c9d45f

Monday, April 2, 2012

The Geography and Natural Resources of Alaska


Alaska is America’s last frontier.  The origin behind this nickname came from its isolation from the rest of the continental United StatesAlaska is a vast region with rugged terrain and harsh climates, bordered by Canada and several bodies of water.  Many resources can be found in this remote land, but one of these resources, oil, has started controversy among its environmental impact and as a result has plagued this region.   

Approximately 50 years ago, Alaska was admitted as the 49th state of the United States.  Europeans first discovered this land in 1741 when a Danish-born navigator, Vitus Bering, who was serving in the Russian Navy, was on an expedition around the northern Pacific Ocean.  During this expedition, he sighted land on the southern coast of Alaska, in an area known as Kayak Island, in addition to the Aleutian Islands.  Another vessel, captained by Aleksei Chirikov, was sailing along side of Bering’s ship when a storm separated them.  Chirikov continued to explore and traveled to various points along Alaska’s coast until his crew became ill and the journey could no longer continue.  From this point, the Russian’s occupied the Alaskan territory; however much of it was unexplored.  On October 18, 1867, the land was purchased by the United States for approximately $7.2 million dollars.  Alaska has many geographic landscapes within its boundaries; some of which have helped its economy and others which may it difficult for settlements to survive.  Gold and oil have had a significant impact on Alaska’s geographical landscapes, while the climate has prohibited development in many places across the vast region.  

Alaska’s economy has improved over time due to an abundance of resources.  Timber, oil, sea foods, and tourism have all contributed to this growth.  Furthermore, Alaska was first attracted to Americans by the gold rushes of Juneau, Circle City, Klondike, Nome, and Fairbanks in the late 1800’s.  Over 30,000 people flocked to these areas in the hopes to strike gold; however, with the increase in population, Congress had to start applying laws to the territory to keep order.  After the gold rush had ended, many of the people who originally migrated to Alaska ended up staying there which resulted in Alaska’s population quickly increasing.  Small settlements grew into big towns, such as Fairbanks, Juneau, and Nome.  Also, the development of a railroad system in Alaska was built to connect mines throughout the territory to the port of Seward, located on the southern coast of Alaska, which allowed the flow of goods and resources to be dispersed.  The Alaska railroad connected the towns of Fairbanks, Anchorage, and Seward.  Eventually, as time progressed, the railway was growing with the increase of military personnel moving supplies and other resources in increasing demand.  The economic, cultural, and political geography of this land had transformed greatly after the discovery of gold.  Economically, the gold rush contributed to a growing economy that assisted in the establishment of many new settlements during the turn of the century.  Culturally, the area of Alaska with gold deposits was predominately Native Americans.  The gold rush expanded the culture with the massive amounts of people migrating to these areas.  New customs, religions, and beliefs contributed to the socio-economic way of life that was originally not available.    Lastly, the political geography of Alaska was slowly changing in order to cater to the growing population.  Congress and the United States started recognizing Alaska; instead of being a vast open land, it was seen as an area of the United States with an abundance of resources.  This observation provoked many changes in the laws of Alaska.
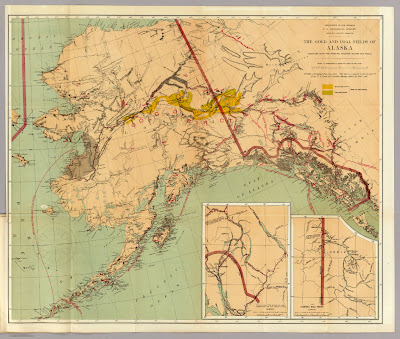

                   Figure 1: Map published in 1898 and covers areas abundant in gold and coal

Another major improvement to Alaska’s economy was the opening of vast oilfields in northern part of the state.  In the 1970’s, the United States authorized a pipeline to be built to transport the oil from the Arctic Ocean at Prudhoe Bay to the Gulf of Alaska at Valdez.  The pipeline, which is called the Trans-Alaska Pipeline System, runs approximately 800 miles between these two areas and has transported over 15 billion barrels of oil since it was built.  In Valdez, the oil is then shipped from the port of Valdez to the mainland of the United States for further refining.  Supposedly, there is also a great abundance of oil that can be found in the Arctic National Wildlife Refugee (ANWR), located in northeastern Alaska and other areas of the Arctic; however, environmentalists continually fight the possibility of drilling in this tundra region.  In an article by Mitchell, he states “much of the debate over whether to drill in ANWR rests on the amount of economically recoverable oil, as it relates to world oil markets, weighed against the potential harm oil exploration might have upon the natural wildlife.”  Some of the animals, birds, and mammals in these habitats that would be affected include caribou, polar bears, walrus, and whales, among other species.  In addition to damaging the habitats of these animals, there is also political and cultural landscapes affected.  Politically, the Canadian government opposes anytime type of drilling in this area due to the shared boundary with the Yukon Province.  Two Canadian national parks, Ivvavik and Vuntut are located in the vicinity of the opposed drilling sites and also provide refugee for various types of animals, especially caribou.  These parks have banned any type of industry from developing these lands and expect the United States to treat these lands with the same respect.  Since the discovery of oil in Alaska, it has become a major revenue of the state, in addition to income for many Alaskans.  The residents of the state along with the Alaskan government are for the idea of drilling in these protected lands because it will increase profit and revenue for them from the oil leasing.  The Native Americans of the geographic region have split views on whether to drill or not depending on where they live.  For instance, the Inupiat Eskimos who live north of the mountains named Brooks Range, are for onshore drilling, but oppose to offshore drilling; where as the Gwich’in Indians, south of the Brooks Range, pose the drilling as a threat to their environment.  Other supporters of the drilling argue that the oil able to be salvaged beneath northern Alaska’s tundra could equate to many decades of importing oil from the Middle East.  This would decrease our dependency on oil from foreign countries and reinvest our money in our own economy vice in a foreign government.  Regardless, of the aforementioned pros and cons, there still has not been enough research to determine how the drilling would really affect the geographic landscape of northern Alaska.  Many of the geographic landscapes affected by the extraction of petroleum have had similar results to Alaska’s economy as in the gold rush.  Petroleum extracts make up the majority of revenue for the state of Alaska.
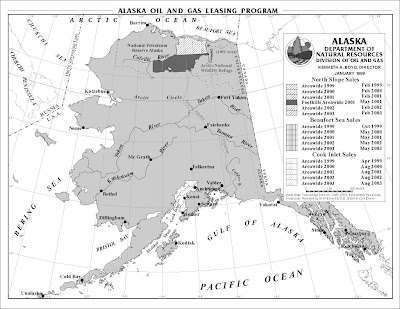

        Figure 2: Map published in 1999 by the State of Alaska’s Oil and Gas Division

The physical geography of Alaska is mostly mountainous with 14 ranges covering the majority of area within the state, along with hills, valleys, and rivers.  Natural disasters such as earthquakes and volcanoes are known to have helped shape the geography of Alaska over the past millions of years.  In addition, Alaska is surrounded by water on three of its sides: Arctic Ocean to the North, Bering Sea to the West, and the Pacific Ocean to the South.  The total area of these three bodies of water consists for 43,887 miles of the coastline.  However, most of Alaska’s physical geography is very remote and inhabitable and covers approximately 590, 804 square miles.  It is extremely cold making it very difficult for any type of agriculture, cultivation, extensive development, or permanent settlement for most people.  The largest city, Anchorage, does not have more than 300,000 people residing in it.  Most of the northern lands are tundra and permafrost.  Permafrost consumes about 80% of Alaska and impacts the physical infrastructure of Alaska.  Constructing buildings over permafrost could cause it to melt resulting in the buildings to partially sink.  Similarly, roads in permafrost areas can cause the subsurface to melt resulting in road depressions and expensive repairs.  Since it is so inhabitable, the region has not been explored in great detail; however, in addition to what has already been found, it is possible there may be even more resources in gold and oil that have not been found and which would be very beneficial to Alaska.

In conclusion, many industries have been established in Alaska.  Gold, copper, and coal mines have been created from the abundance of resources located within or near the various mountain ranges in this geographic region.  In addition, oil and gas pump stations have been created from various regions in the north.  Since the land is so remote, railroads and pipelines have been built to transport theses resources to other parts of the country, mainly through the ports of Valdez and Seward.  Unfortunately, between the northern and southern regions of Alaska, the land is extremely rugged and unstable, with three mountain ranges, permafrost, rivers and streams, and many migration paths for animals, in addition to active fault lines.  As a result, the geological activity between the north and the south has caused many problems for the pipeline, as well as the railroad, which does not travel as far north.


Saturday, March 31, 2012

Applying Geographic Information Systems to Real-world Issues - Cell Tower Mapping

Case Study Proposal:

PROPSED TITLE:
The identification of 25 potential sites to construct cell phone towers around the Greater Boston Metropolitan Area

ABSTRACT 
This study will examine the potential for a design of a project in regards to a wireless phone company who is interested in expanding their communication network to receive better coverage in the Greater Boston Metropolitan area of the Commonwealth of Massachusetts.   The project will consist of sorting through many datasets available online via http://www.mass.gov/mgis/massgis.htm and then downloading key features that may assist in the creation of geodatabases.  Ultimately, this will align the various analyses of determining which datasets will reveal ideal locations for the new cell towers.  Furthermore, new developments have boosted the population in and around Boston creating a greater demand for communication technologies, especially as the networks are expanding into 4G standards.

MASS.GOV LAYERS
The following layers will establish a base foundation dataset in order to perform several different types of analyses.  Some of these datasets may be repetitive (i.e. some of the data will be downloaded for awareness) or may only be used as a reference and not in the actual analyses  (which are located immediately below).

BACKGROUND LAYERS:


RASTER LAYERS
Elevation
·         Shaded Relief (1:5,000)

VECTOR LAYERS
Census/Statistical Data
Ground Suitability Data
·         Impervious Surface (raster to vector conversion)
Conservation/Recreation (merge into one shapefile)
Infrastructure
Transportation
Other Facilities (merge into one shapefile)
Physical Resources
Topography
Water Features (Merge into one shapefile)
ADDITIONAL LAYERS
Additional layers can be found at http://wireless.fcc.gov/geographic/index.htm - it is important to understand the current cell tower infrastructure in identifying gaps in coverage or where they may lay in regards to more population density in one area over another.  Also, major thoroughfares need to have consistent connectivity for travelers as well as be able to handle the influx of users on a cellular network.  This site provides maps showing FCC licensing data, regulated towers, and market area boundaries.  These maps then need to be converted into a raster file and eventually digitize to extract the generated information on the map into vector files.  Another website I would extract data from would be www.cloudmade.com.  There are no guarantees on what type of data will be available, but cloudmade.com allows you to download various shapefiles of landmarks, infrastructure, and other user-generated data that has been uploaded to openstreetmaps.com.  Acquiring traffic data will also be of value for this project in order to identify high trafficked areas of cars along major thoroughfares.

METHODOLOGY
There are several types of analyses I would use within ArcGIS in order to conduct this project.  Proximity analysis is useful in several different ways.  First and foremost, in this project the geographic constraint is 25 miles outside of the Boston city limits.  I will create an extent polygon in order to clip out each of the attributes of my shapefiles that fall outside of this area.  This will allow me to use smaller datasets and not have to be concerned with highways and schools (including colleges and universities) outside of the constraint, among many other shapefiles’ attributes.   On the other hand, some of the features are not necessarily that important by themselves.  For example, there are various types of water features or conservation/recreation layers that do not need to be standalone files.  Merging these various datasets in order to eliminate unnecessary cluster is important so there is less data to work with.  The important factor as a result is that at least the water features and conservation layers are captured since building a cell tower is not an option within these locations.  Another type of proximity analysis is buffering.  In order to identify build zones, a 1 mile buffer must be conducted around the MassDOT Roads (attribute: highway) shapefile and then the lines must be dissolved in case several highways are in close proximity to one another.   In addition, buffering must be done with a radius of 1 mile around all schools.  Once the new shapefiles are generated as a result of the buffering tool, I will overlay each of the buffer files and delete from the highway buffer, wherever the school buffer file overlaps to minimize the amount of ideal locations.

Besides proximity analysis, other types of analyses will be useful in finding ideal locations for the new cell towers.  Towers need to be located in areas where population density is higher than normal to cater toward the influx of people utilizing the network.  As a result, a population density analysis must be conducted based from census data.  Elevation data can assist in terrain analysis in order to identify any hills or peaks above and beyond 250’ above sea level.  Once this area is identified, soil and hydrographic analysis will be conducted in order to determine the ground suitability for building the tower to ensure it is placed in a strong foundation.  Lastly, since cell towers need to be in a close proximity to other cell towers, the next type of analysis I will conduct is a Line of sight analysis to ensure the newly identified locations are within a certain distance from other towers and there are no vertical obstructions and to identify the potential cell coverage. 

CONCLUSION
The results of this project should determine what areas within the Greater Boston Metropolitan region are ideal in order to build new cellular towers.  The additional datasets from the FCC website will help to alleviate any overlapping towers in order to improve the communications network.  Geospatial data of the amount of users per cell towers in and around the ideal locations would probably improve this study.  Since urban and rural areas have different needs in regards to cell tower use, towers need to be located in ideal locations, but since cell towers are known to possibly cause health issues, towers must stand clear of schools and recreational areas.

LIMITATIONS
This most anticipated roadblock will be the accuracy of all of the data.  Not all the data in the files being used has been captured in the past year.  Therefore, some of the data may be missing components crucial to a full and complete analysis of identifying ideal locations.  Further research needs to be done to confirm the validity of all the data.  For example, have any schools closed down since the shapefiles were generated or have new school been built would be questions that need to be answered.   Also, an urban legend about cell towers is often told that they cause cancer and serious health risks.  Cellular technology is a relatively newer technology and the health community is unable to confirm this suspicion as of yet; however, the public still has some reservations about them being erected nearby to residential areas.  Lastly, the wireless company may have to pay rent for the location of the tower especially if it’s close to residential areas because of the depreciation of property that it will affect the neighborhoods the towers are being built around.

Geographic Conflicts of Land

Territorial boundaries drawn by past empires, who have had little regard for geographic realities, often become major sources of conflict.


Throughout history, empires have chosen specific boundaries based on mainly cultural and physical geographic areas.  The British Empire, which controlled many geographic areas in various continents throughout the world, was notably known for performing choosing specific boundaries.  Frequently, in the news I see Israel and its territorial disputes with its neighbors; therefore, I have decided to focus on Israel’s sources of conflicts based on its boundaries.  I will begin with a brief geographic history of Israel for an understanding of its current events. 


The land now known as Israel was once called Palestine is considered a holy land to the Muslims, Jews, and Christians.  Ancient Hebrews that lived in this region called the area Caanan.  After 1000 B.C., this area was split into two different kingdoms which were called Israel and Judah and were invaded by other empires constantly, some of which were the Egyptians, Macedonians, Romans, Persians, and the list continues.  Most of the original Hebrews who settled the region were then forced to emigrate elsewhere.  Afterwards, Palestine became a center of Christian pilgrimage after the emperor Constantine converted to that faith.  Hundreds of years later, the Arabs gained control of Palestine from the Byzantine Empire and Muslims continued to rule this region until the 20th century.  Throughout this period, Hebrews started to settle back into Palestine. During World War I, British forces defeated the Turks in Palestine and governed the area until they officially withdrew in 1948, which formed the State of Israel.  In the following days, Muslim forces from Egypt, Jordan, Syria, Lebanon, and Iraq invaded the new formed nation.  As a result, Israel had increased its original territory by 50%, taking western Galilee, a broad corridor through central Palestine to Jerusalem, and part of modern Jerusalem.  Almost a decade later, Egypt nationalized the Suez Canal and forbidden Israeli shipping to travel through the newly created canal.  This led Israel to seize the area known as the Gaza Strip located on the Sinai Peninsula.  Another decade later, Israel made simultaneous attacks against Syrian, Jordanian, and Egyptian air bases, totally defeating the neighboring Muslim nations which tripled the size of Israel’s territory.  The areas controlled by Israel were the Golan Heights, the West Bank of the Jordan River, Jerusalem's Old City and the Gaza Strip.


As a result, the dispute over the territories controlled by Israel has created a sense of instability in the region.  The land that was provided to the Hebrews from Great Britain is now in constant turmoil.  The Palestinians, who are of Arab descent, are now looking to regain control of their land.  Constant upheavals in the area known as Gaza continue to rise.  The primary issue that continues to instigate this conflict is the attempt to maintain an ethnically preferred state which is inevitable considering the majority of people in Israel are now Jewish.  This region once was mainly settled by Muslims; however, they are now prohibited from returning to their homes because the state proclaims Judaism.  Furthermore, Israel’s military occupation over the aforementioned regions that were seized prior to the 1970’s is still burdensome to the Palestinians who have minimal control over their lives and live in disarray daily.  Peace efforts continue to try to resolve this conflict, but Israel refuses to give the controlled land back to its rightful owners who were forced out.  Obviously, when the original borders were implemented, no one took into consideration that people would be forced out and not have anywhere to go.  Hopefully in the future, Israel will resolve this issue by giving back the Gaza, West Bank, and the other areas they have taken control of especially because it is a constant battle to keep these lands for Israel.  


For the record, I have no bias toward either side; I am just stating my observables.

Friday, March 30, 2012

Kashmir - The Geography of Terrorism and Nuclear War

There are two main international concerns with respect to South Asia: Terrorism and Nuclear War.  Both concerns can be originated from a mountainous geographic region known as Kashmir, in northern India.  I will begin with a short history of the region for an understanding of its cultural and political geography.

The former state known as Kashmir has been disputed for over 50 years between India and Pakistan.  The conflict started shortly after the British Empire gave independence to India and Pakistan which was around August of 1947.  Immediately following the independence, the Marharaja of Kashmir, Hari Singh, contemplated which country would be more advantageous for his state to join.   Both, India and Pakistan were divided by the British due to their religions and Kashmir was left to make a decision to transfer their power peacefully.  Singh was torn between his religion, Hindu, and the majority religion of his people who were mostly Muslim.  Since there was a larger Muslim population than Hindu, Pakistan and the people of Kashmir wished to become part of Pakistan.  In addition, Pakistan feared that India would cut off their water supply coming from this region.  Kashmir has a diversity of different religions throughout its region.  In the 1940’s, the total population was just over 4 million people, approximately 77% were Muslim, 20% Hindu, 1.5% Sikh, and 1% Buddhist.  However, the ruler of Kashmir, Hari Singh, practiced Hindu beliefs; therefore, creating a religious conflict.  This resulted in extensive violence in the region between Hindus and Muslims.  Overall, Singh’s conflicting dream was to continue ruling Kashmir as an independent nation. 

A few months later, the Pakistani army and Pashtun tribesman from Pakistan invaded Kashmir in hopes to seize the land for Pakistan.  They pillaged towns, looted, and raped Kashmiri women.  In response, Singh annexed Kashmir to India in return for military aid from the Indian army which would defend Kashmir.  Shortly thereafter, the United Nations ordered a ceasefire at the end of the first Kashmir war.  As a result of the invasion, Pakistan occupied a substantial part of the Kashmir valley, totaling approximately 36,000 square miles.  In 1963, Pakistan ceded an area known as Trans-Karakoram Tract to China; however, India still claims this area because they do not recognize Pakistan’s region of Kashmir.  Since turmoil continued to affect the region in two more wars, the United Nations has attempted to resolve the conflict by enacting new resolutions.  However, this region of South Asia has caused much violence contributing to this conflict, due to its sparse and different cultural geography.  Kashmir is on the brink of a nuclear war due to this conflict between Pakistan and India.  Moreover, many terrorist groups are being harbored in this region that is also in support of Al Qaeda, among other groups.  This has created much indifference between Pakistan and India resulting in several wars and instability in the region.  As a result of the unstableness in this geographic region, the international community is extremely concerned of what the outcome might be.

Separatist violence in Kashmir has been increasing as time has progressed.  India continues to blame Pakistan-based militant groups for many deadly attacks against Indian civilians, in addition to Indian government security forces.  Most of these militants have ties to Islamic terrorist groups as well.  In March 2003, the chief of India’s Defense Intelligence Agency reported that “70 Islamic militant camps are operating in Pakistani Kashmir. In May 2009, the Indian Defense Minister claimed that about 3,000 “terrorists” were being trained in camps” on the Pakistani-controlled region of Kashmir.  In addition, it is thought that Al Qaeda may be active in Kashmir as well (Kronstadt 2003).  Indian authorities are also urging that the U.S. and international community pay closer attention to anti-India terrorism originating from Pakistan.  Another international concern between these two countries is the possibility of nuclear war.  In 1998, Pakistan and India both tested nuclear bombs; thus escalating a minor conflict into a possible nuclear conflict.  Since then, there have been concerns over if the two countries would resolve the conflict by nuclear resolution.  Both countries also have their own extensive nuclear policy.  Pakistan’s nuclear policy is “is to act in a responsible manner and to exercise restraint in conduct of its deterrence policy.”  Their nuclear policy also does not want their capabilities to affect non-nuclear weapon countries within in the region; therefore, Pakistan’s nuclear policy seems to allow a nuclear attack only on the defensive.  On the other hand, India’s nuclear policy stands on the offensive.   Its policy will have nuclear involvement only if India is reacting to a nuclear, biological, or chemical attack that affects their land or citizens.

Tuesday, March 27, 2012

Geographic Civilizations - Sumer


The Sumerians are known in world history as being the first civilization dating back to around 3000 B.C.  They excelled in many areas for a civilization of that time.  Furthermore, they established the basics for socio-economics and intellect in the area known as present-day Iraq, nestled in-between the Tigris and Euphrates River.  Many breakthroughs and inventions assisted in the foundations of the Sumerian society which lasted for approximately 1000 years.

Their society was headed by a king and divided into four sets of classes: nobles, clients, commoners, and slaves, which all contributed in some way to their flourishing culture. The Sumerians were heavily involved in trade, whether it was with other nearby civilizations or in the Persian Gulf.  Within their own city-states, citizens were involved in various types of trades, such as masonry, metalworking, and pottery to contribute to the culture within, and trade with foreign entities outward.  Agriculture was a necessity and therefore led to an intensive system of irrigation being created by digging canals from the major rivers.  This lead to rich land for growing food.

Moreover, the Sumerians established a system of writing which was depicted in several forms: pictographs, ideograms, and phonetic signs.  This system of writing bridged the gap between Sumerian city-states and their following generations.  Mathematics, specifically geometry and trigonometry, played a huge role in assisting the Sumerians in erecting structures, such as palaces, temples, ziggurats, canals, et cetera.  Lastly, the Sumerians also used a system of medicine to rid citizens of sickness (or rid them of evil spirits).  Several different treatments were used to help cure the sick and these treatments consisted of magic, surgery, and prescriptions, or even a combination of all three.

All of the aforementioned reasons laid the groundwork for a flourishing civilization in Mesopotamia.  Their influence and culture followed onto other civilizations that conquered in the same geographical region such as the Semites and the Babylonians.  Ultimately, Sumerian culture helped form political and economic stability in the civilized world for the following civilizations to come.  

Sunday, March 18, 2012

Online GIS information on Map Analysis

I came across the following site that has a wealth of free information on Geographic Information Systems'(GIS)-related information by Berry & Associates // Spatial Information Systems (BASIS).  Map Analysis is a great subject for anyone interested in analyzing maps especially through GIS. A link to the material is http://www.innovativegis.com/basis/


There are presentation slides in the "Online Books and Materials: Map Analysis Workshop Materials" by Joseph K. Berry that go over various topics in the workshops presented such as Introduction and Data Considerations, Spatial Analysis Techniques and Considerations, Spatial Statistics Techniques and Considerations, GIS Modeling Approaches and Considerations , among others.

There is also a free online book which can be downloaded that covers a wealth of topics such as Spatial Interpolation Procedures and Assessment, Where Is GIS Education?, Analyzing Accumulation Surfaces, Linking Data Space and Geographic Space, Analyzing Landscape Patterns, Applying Surface Analysis,  Human Dimensions of GIS, Overview of Spatial Analysis and Statistics, Spatial Data Mining in Geo-business and much more.

A link to the book can be found here: http://www.innovativegis.com/basis/mapanalysis/

Happy Reading!

Tuesday, March 13, 2012

The Clash of Civilizations? or the Geography of Power, Greed, Resources, and Territory


Recently, I came across a book called the Clash of Civilizations by Samuel P. Huntington which takes a look at people's cultural and religious identities and argues that this will be the primary source of conflict in the 21st century.

I believe that the clash of civilizations seems to be a very broad statement in the use of Huntington’s thesis.  Personally, I have mixed feelings towards Huntington’s theory.  On one hand, it is possible to picture the validity of the clashing of civilizations; however, on the other hand, I am in agreement with an article by Amartya Sen (2006) titled "What Clash of Civilizations? Why religious identity isn't destiny" that states that “the increasing tendency to overlook the many identities that any human being has and to try to classify individuals according to a single allegedly pre-eminent religious identity is an intellectual confusion that can animate dangerous divisiveness.”  When comparing civilizations, a civilization can be reduced down to a small scale, it doesn’t necessarily have to be compared to historic civilizations such as Ancient Greece, Ancient Rome, Mesopotamia, and so on.  

When comparing people from different parts of the United States such as Texans, Californians, New Englanders, and Georgians, all who are classified as Americans; however, each has their own distinct cultures within the United States.  But what is an American?  An American is not only somebody from the United States, but somebody in Mexico, or Costa Rica.  Back in 2005, I had taken a trip to Costa Rica to immerse in the culture.  One thing I noticed from the people there is that they were offended when Americans were only referred to the people of the United States.  With that said, single classifications can be very misleading.  If civilizations are divided by particular cultures, then Iraq, a majority Islamic state, could be broken up into three different cultures: The Kurds, Sunni Muslims, and Shiite Muslims, but Iraq is also home to other minorities such as Christians (Chaldeans), among many other ethnic groups.  

For Huntington to state that the world is divided into nine different civilizations is a misnomer.  The truth is that Huntington uses only one type of classification which is based off of religion; however, the different cultures within religious groups, classes, societies, and beliefs are other classifications that can be used to distinctly separate people from one another.  In many nations or states throughout the world, conflict usually arises within their own political boundaries as a result of some sort of clash.  It can usually be defined as cultural differences, but not all conflicts are solely violent.  Some may be political or even economical.  I do not believe Huntington is wrong for his ideology, but he is only looking at conflicts within global politics as one possible perception and is not looking outside the lines of religious/cultural classifications.  This sort of realignment that Huntington predicts has occurred throughout history.  

More recently, globalization is now mixing the various different cultures and civilizations throughout the world together and leading these different cultures and religions to share many commonalities than ever before.  On a separate note, Huntington discusses clashes between western civilizations and Islamic civilizations.   The majority of people in western civilization are Christians; therefore, in my opinion, Huntington goes on to discuss the conflicts between these two cultures as a future problem that needs to be considered in foreign policy.  I disagree with his views on this because Christians and Muslims have been fighting for thousands of years and it should already be in our foreign policies.  This is not only a future issue, but a past and present issue as well.


I believe all factors will come into play when conflict occurs, not only cultural factors like Huntington states. Every year, the world is becoming more and more global with technology, especially the internet. Many cultures that were once isolated years ago are now sharing many traits with other cultures because it is becoming the "norm" globally. Immigrants that live in repressed or poor regions of the world are now increasingly migrating to Western countries because they believe it will lead them to more opportunities and a better life. The mixing of cultures is becoming more and more acceptable; however, tensions of cultures worldwide will always have some sort of conflict. Huntington's thesis is inaccurate when it breaks the world into eight different civilizations. Many states and nations within these "8" civilizations have conflicts daily and even within their political boundaries. Therefore, I believe the world is becoming more economical and countries of different cultures are now uniting with other countries of the world for these reasons. The main conflicts will be more of an internal conflict than a worldwide conflict of cultures.


So let's take a step back for a moment at all the major conflicts since the 21st century.  Afghanistan War, Iraq War, Sudanese Civil War, Russo-Georgian War, Arab Uprising revolutions, and radical Islamist jihads.  With the exception of radical Islam, none of these other conflicts were really based on religious ideology.  They were either political, economic, or over territory in my opinion.  


Islamist radicalists can blend in with any society, no matter where it is to cause harm toward others.  In Huntington's thesis, they are mostly concentrated as one civilization, "Islamic civilization."  Regardless, there are no boundaries to these non-state actors and they have developed cells all over the world in many other civilizations than the Islamic one. I would think this would be the closest example that would tie into the thesis.  Yet still, they also fight within their own "civilization" and against other Muslims.  Their interpretation of Islam is very different than other interpretations within the culture.  Not all Muslims believe what these radical Islamists believe in; Islam is supposedly a peaceful religion, this just comes to show that it is not possible to divide the world into civilizations.  

I welcome everyone's thoughts and comments on this posting.  I would like to initiate a respectable discussion.

Saturday, March 10, 2012

Applying Geographic Information Systems to Real-world Issues - Urban Sprawl

Case Study Proposal:


PROPSED TITLE:
Population Growth in Prince William County, Virginia and its Implications on the Environment.

ABSTRACT 
This study will examine the continuous urban sprawl and suburban development in Prince William County, Virginia.  Prince William County is located in the region of Northern Virginia, which is a part of the Washington DC Metropolitan greater region.  Urban development disrupts hydrological and ecological systems, in addition to isolating and degrading local natural habitats.  Over the past few decades, Prince William County has transformed from a rural area with two main population centers, Manassas and Woodbridge, to a thriving society.  Today, these two population centers now are interconnected with a steady stream of roads and neighborhoods.  20 years ago, this area was quiet and had quite a lower population. In 20 years, the population has almost doubled from approximately 216,000 in 1990 to approximately 402,000 in 2010. In addition the county is projected to grow to approximately 555,000 in another 20 years; the county had nearly doubled its population every 20 years since 1950 (population was 22,000 in 1950).  The growth of this county has led to a decline in agriculture and an increase in pollution.  These constraints from growth and development have ultimately resulted in several ecological issues that this study will attempt to address.   Furthermore, this study will identify the spatial patterns associated with the growth and how it has grown over the years. 

RASTER LAYERS
Maps (i.e. Historic, topographic, pre-1990 census maps)  – Any scanned map that has features that can be digitized to fill in gaps from all other data used.

SRTM – Any type of elevation data needs to be used in order to explain why certain areas have not been affected by urban sprawl.

Orthorectified Aerial Imagery – This type of imagery will provide most of the historical data needed to determine foundation data for comparing the present to the past.  Each image used can be digitized to extract data into vector format.

Satellite Imagery – This type of imagery will allow various types of sensors to determine changes via comparing two or more images identify change detection in vegetation, ecology, infrastructure, and other important features in foundation data.

Table 1. Satellite remote sensing data for ecological research.
Satellite
Launch
Sensors
spectrum
spatial resolution (m)
temporal resolution (days)
Landsat
1972
MSS, TM
V, IR
15-80
16
SPOT
1986
HRV
V, IR
10-20
5-26
IRS
1988
LISS, WiFS
V, IR
5-200
5-24
NOAA
1970
AVHRR
V, IR
1100
0.5
OrbView
1998
SeaWiFS
V, IR
1100
1
Terra
1999
MODIS
V, IR
250-1000
2
ERS
1991
AMI
microwave
20
variable
RADARSAT
1995
SAR
microwave
20
IKONOS
2000
IKONOS
V, IR
1-4
KOMPSAT
2000
EOC, OSMI
V
6-800
Source: http://www.klter.org/EVENTS/Conference00/html/leegusung.htm

VECTOR LAYERS
LULC (Land use land cover), including current and historical datasets  – This provides an idea of where the different feature classes of land type and uses are located.

Census: 1990 and newer census tracts, population – Census data reveals where the population is with any given area.

Hydrographic: rivers, streams, lakes, watershed – Hydrographic features are part of a foundation dataset.

Infrastructure: roads, rails, powerlines, pipelines – Infrastructure features are part of a foundation dataset.

Environment: Air Quality maintenance area, water quality monitoring station – Reveals location of areas that monitor changes in the environment.  This allows for the validity of data acquired in relation to air and water quality data compared to sensors that capture quality via remote sensing.

Boundary: County and cities – Provides an outline for the areas of interest.

METHODOLOGY
The methodology used for studying the issue of population affecting the local ecology requires two different datasets themed to a specific time frame, one pre-1990 dataset and one post-1990 dataset.  The area of interest that will be studied is within the county borders of Prince William County, Virginia, including the cities of Occoquan, Manassas, and Manassas Park.  A foundation dataset based on the aforementioned criteria is needed to identify changes and challenges that urban growth has had within the county.  GIS allows this foundation dataset to be overlaid with land cover and other raster and vector files that have a relation to identifying the affects of increased population in the county with files that can help determine factors that affect the ecology such has changes in county infrastructure.

In order to accomplish this, GIS plays an instrumental role in conducting spatial analysis between feature classes and identifying relationships among the two topics: population and ecology.

Not all datasets are readily available in can be used immediately for spatial analyses.  Most of all raster files in this project will have to be scanned and inputted into the system.  At this point, each file, whther it is a photographic image or a map needs to be spatially referenced in the area it is detailing.  Digitizing these types of files is a necessity once the files are geo-referenced in order to extrapolate any valuable vector datasets from the map or images, such as landcover and landuse, vegetation, missing pieces to infrastructure (i.e. roads, buildings, parks, waterways, et cetera), et cetera.  Most of the raster files that are not used for creating vector datasets will be used for identifying air quality, pollution, water quality, and most other ecological readings within the county.

Population data acquired from the U.S. Census Bureau and Aerial Photography will be monitored over the past 60 years, in 5 to 10 year increments depending on how much the population has changed the landscape of the county.  Each 10 year increment changes will be identified in GIS and then compared to see the progression of change temporally.  The decrease of agricultural land will also be identified in GIS via this process.

CONCLUSION
The results of this project should determine what areas within Prince William County have endured more drastic changes than other areas, as well as what areas need to be protected from any further development.  In addition, this project will visually and temporally depict the changes over time in regards to population growth, infrastructure changes, changes in water levels, air quality animations, and vegetation changes.  Overall, the results will identify spatial patterns that have directly impacted how the area has grown into what it is today from what it was 60 years ago, while simultaneously affecting the ecology of the area.

LIMITATIONS
This most anticipated roadblock will be the acquisition of data needed to fulfill all the requirements in order to do spatial analysis and observations.  Secondary to do this, the time involved to complete this project will be dependent on the amount of change and extraction that is needed from the ingestion of maps or photographic images.  The more gaps in the vector data, the more time needed to extract from the raster files.